
Spectral Doppler: Coronary Arteries
Obtaining the spectral Doppler
- Identify the coronary arteries in the mid-esophageal aortic valve views. Either of the two following two-dimensional TEE views can be used:
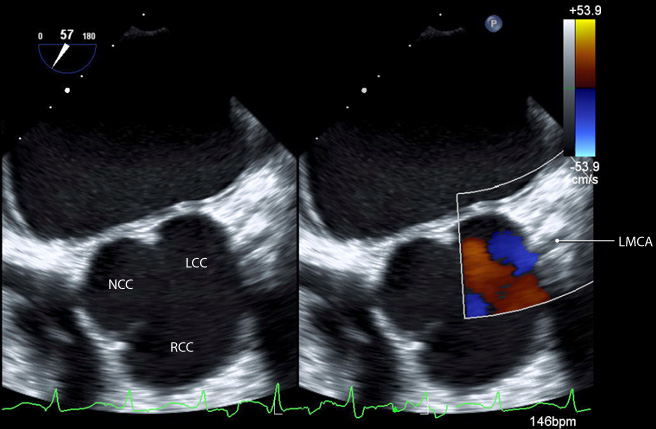
- To identify the left main (LMCA) or the proximal anterior descending coronary artery, withdraw the probe from the mid-esophageal aortic valve short axis view. To aid in identification of the LMCA, apply colour Doppler over the left sinus of Valsalva.
- The right coronary arter (RCMA) is less accessible but maybe visualized within the mid-esophageal aortic valve short or long axis views adjacent to the right sinus of Valsalva.
- To assess flow in a coronary artery, place the pulsed wave (PW) sample volume within the artery (figure 1).
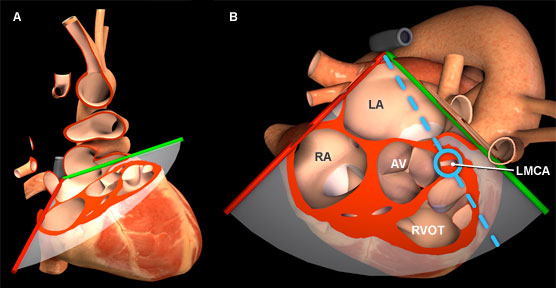
Figure 1: Three-dimensional heart model shown in cross-section to highlight the position of the TEE plane in the mid esophageal aortic valve short axis view. A) Anterior view of the heart with TEE plane. B) Superior view of the heart and TEE plane. The blue dotted line represents the orientation of the pulsed wave cursor and the blue circle indicates the position of the sample box in the left main coronary artery. Key: AV = Aortic valve, LA = Left atrium, LMCA = Left main coronary artery, RA = Right atrium, RVOT = Right ventricular outflow tract.
Features of coronary artery spectral Doppler
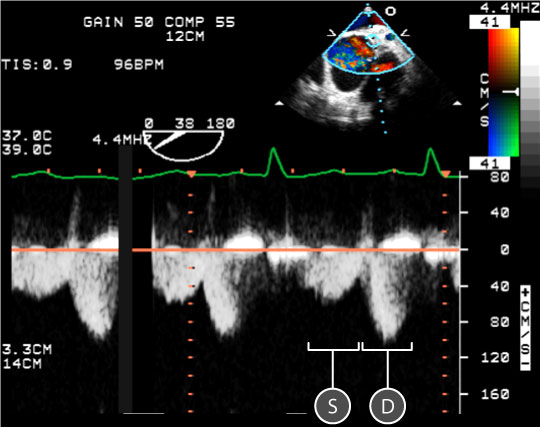
Figure 2: Spectral doppler data acquired for blood flow through the left main coronary artery (LMCA). In the upper right, a two dimensional TEE image of the mid esophageal aortic valve short axis view; the blue circle indicates the location of the sample volume at the LMCA. In the lower half of the image, a spectral doppler trace shows the relationship between red blood cell velocity and time. The baseline is orange. Key: D = Diastolic wave, S = Systolic wave.
- A normal coronary artery spectral doppler trace has two peaks: the Systolic (S) and Diastolic (D) wave. Both waves are seen below the baseline as the direction of blood flow is away from the transducer (figure 2).
- The D wave is larger than the S wave.
- Maximum velocity of blood in coronary arteries measured using PW Doppler.
Coronary Artery D wave maximum velocity S wave maximum velocity Left main 71 ± 19 cm/sec 36 ± 11 cm/sec Right main 39 ± 12 cm/sec 25 ± 8 cm/sec
Physiological variation
Pathological variation
- Aortic stenosis
- Ischemic heart disease (↑ flow turbulence)
- Note: To assess coronary artery flow reserve use adenosine or dipyridamole