
Spectral Doppler: Descending Aorta
Obtaining the spectral Doppler
- Identify the descending aorta in the mid-esophageal descending aorta long axis (LAX) view:
- Place pulsed wave (PW) sample volume through the centre of the proximal or distal descending aorta (figure 1).
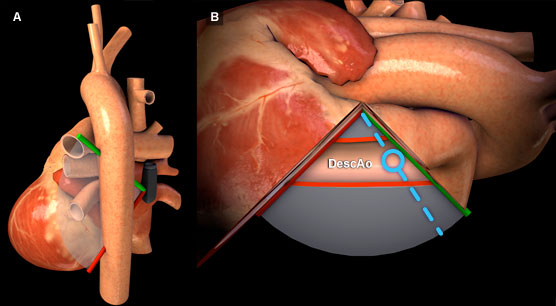
Figure 1: Three-dimensional heart model shown in cross-section to highlight the position of the TEE plane in the mid-esophageal descending aorta view. A) Posterior view of the heart with TEE plane. B) Anterior view of the heart and TEE plane. The heart is rotated about the long axis ninety degrees in a clockwise direction. The blue dotted line represents the orientation of the pulsed wave cursor and the blue circle indicates the position of the sample box in the proximal portion of the descending aorta. Key: DescAo = Descending aorta.
Features of descending aorta spectral Doppler
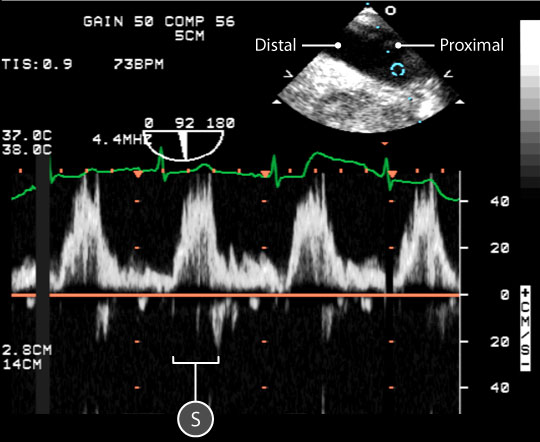
Figure 2: Spectral doppler data acquired for blood flow through the descending aorta. In the upper right, a two dimensional TEE image of the mid esophageal descending aorta LAX view; the blue circle indicates the location of the sample volume in the proximal portion of the descending aorta. In the lower half of the image, a spectral doppler trace shows the relationship between blood velocity and time. The baseline is orange. Key: S = Systolic wave.
- A normal descending aorta spectral doppler trace has a predominant single systolic (S) wave with short early diastolic flow.
- Placing the PW sample box within the proximal aorta displays systolic flow above the baseline, as blood flow is towards the probe (figure 2).
- Placing the PW sample box within the distal aorta displays systolic flow below the baseline, as blood flow is away from the probe (figure 3).
- The aortic wave Maximum velocity (VDescAo) is 100 - 140 cm/sec.
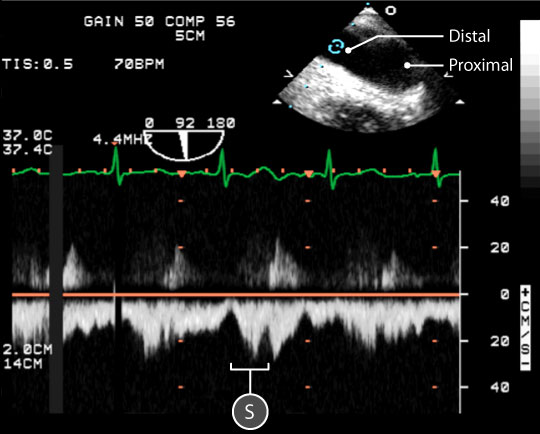
Figure 3: Spectral doppler data acquired for blood flow through the descending aorta. In the upper right, a two dimensional TEE image of the mid esophageal descending aorta LAX view; the blue circle indicates the location of the sample volume in the distal portion of the descending aorta. In the lower half of the image, a spectral doppler trace shows the relationship between blood velocity and time. The baseline is orange. Key: S = Systolic wave.
Physiological variation
Pathological variation
- Aortic insufficiency
- Aortic dissection